A business impact analysis is the systematic process that identifies which business functions an organisation cannot do without, and measures what happens, and how quickly, when each one stops. It works like triage in an emergency department: nothing can be restored all at once, so the analysis decides the order of restoration in advance, while there is still time to think about it properly.
It is the second phase of the business continuity planning lifecycle, and the phase everything downstream is judged against. Recovery strategies, site selection and continuity spending are all answers to questions the analysis asks, which is why choosing any of them first inverts the sequence. It is also where continuity stops being a technical exercise: what counts as critical, and how long the organisation can survive without it, are business judgements only the business can make.
What is a business impact analysis?
A business impact analysis evaluates the effect of a disruption on an organisation’s critical business functions. It catalogues what the organisation does, establishes which activities genuinely matter, and quantifies how the harm from losing each one grows as time passes.
The most useful way to understand it is by what it leaves out. The analysis does not ask what caused the outage. Fire, flood, ransomware or a supplier going under all produce the same question: this function is gone, so what now? That threat-agnostic stance is the clearest line between the analysis and a risk assessment, and it is why the analysis can be conducted once and stay valid across every threat the organisation faces.
The two questions a BIA asks about every function
Strip the methodology away and the analysis asks two things of each function. What happens if this stops, measured in consequence rather than inconvenience? And how long before that consequence becomes unacceptable? Criticality rankings come from the first, recovery targets from the second.
BIA vs risk assessment: what each one measures
The analysis, the risk assessment and the continuity plan are related and routinely conflated. The cleanest separation is by the question each one asks.
| Business impact analysis (BIA) | Risk assessment | Business continuity planning (BCP) | |
|---|---|---|---|
| Core question | What happens if this function stops, and how soon must it return? | What could go wrong, and how likely is it? | How do we keep operating when something goes wrong? |
| What it measures | Consequence and time, independent of any specific threat | Likelihood combined with the impact of identified threats | Strategies, procedures and resources for continuity |
| Key output | Criticality rankings, recovery targets, dependency maps | A prioritised risk register and treatment decisions | The documented continuity strategy and plan |
| When it happens | Early in the continuity lifecycle, after project initiation | Independently, or alongside the business impact analysis | After the business impact analysis, informed by its findings |
| Threat dependence | Threat agnostic | Threat specific | Applies to whichever threats materialise |
The two inform each other rather than competing. A risk assessment may establish that a data centre sits in a flood zone, which is a threat with a measurable likelihood; the impact analysis then asks what losing that data centre would cost. They also differ in purpose: the impact analysis exists to support continuity planning, while risk assessments are run for compliance, insurance and audit quite independently of it. How a quantitative risk assessment does its arithmetic, and why annualised expectancy is not the same as impact measured over an outage, is worked through in the quantitative risk formulas guide.
CISSP Exam Note
A scenario describing the likelihood of a fire at a data centre is describing a risk assessment. One asking how many hours the organisation can survive without its order processing system is describing the business impact analysis. The tell is whether the question is about probability or about consequence over time.
What are the five steps of a business impact analysis?
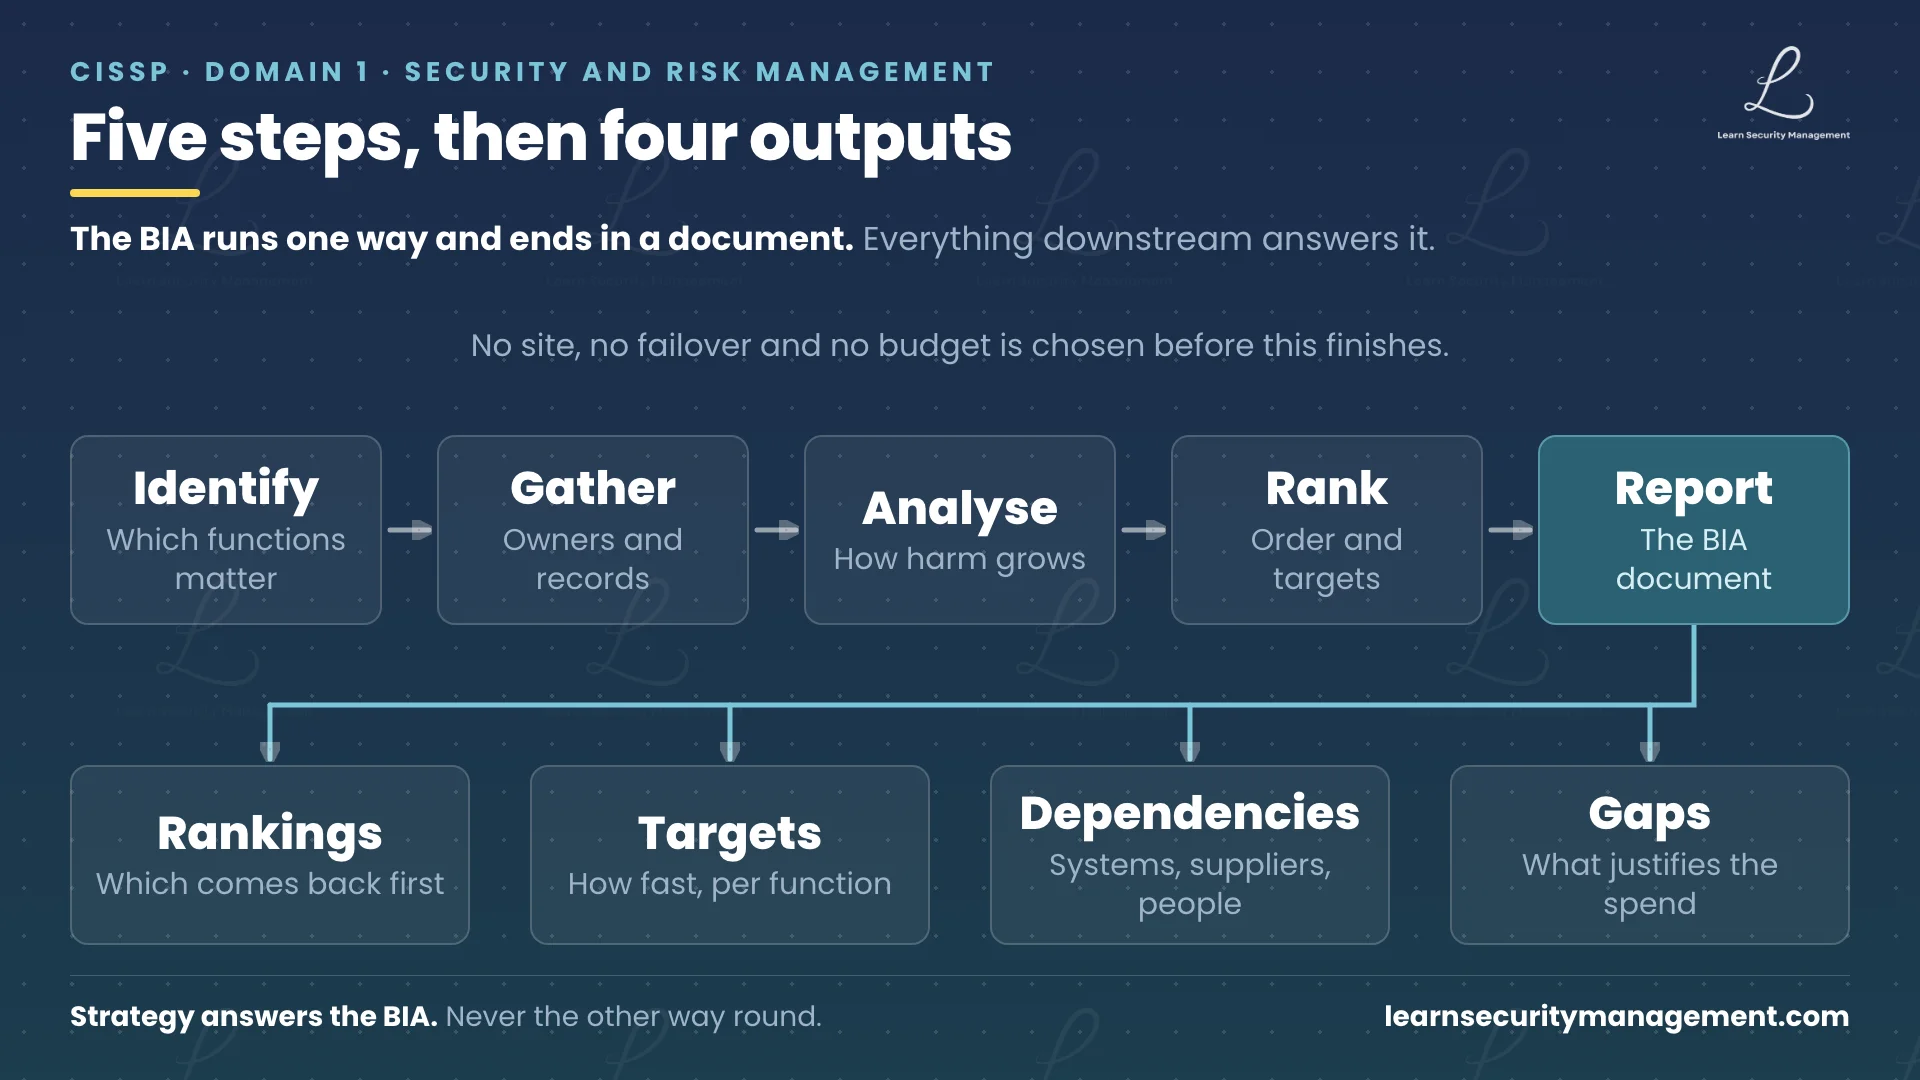
The methodology varies in its details between organisations, but the sequence is consistent: identify critical business functions, gather data about them, analyse the impact of losing each one, determine recovery priorities, and document the findings in a report that senior management approves.
NIST SP 800-34 Rev. 1, the Contingency Planning Guide for Federal Information Systems, places the business impact analysis as step 2 of its seven-step contingency planning process and breaks it into three parts of its own: determine business processes and recovery criticality, identify resource requirements, and identify system resource recovery priorities. It addresses information system contingency planning rather than organisation-wide continuity, but its treatment maps cleanly onto the steps below.
Who conducts a business impact analysis, and when it must be redone
The analysis is not something IT performs alone. It is closer to running a census of the organisation’s processes: going department by department, interviewing the people who own the work, and assembling a picture of what breaks when any piece of it stops.
The cross-functional BIA team
Senior management authorises the analysis and ensures business unit leaders actually participate; without that backing the team lacks the authority to get time from busy people. Business unit leaders know which of their processes generate revenue, serve customers or carry regulatory obligations. Finance supplies the revenue figures and penalty amounts, IT maps the technical dependencies, legal and compliance identify deadlines and exposure others would not see, and human resources address staffing, remote working and reliance on individuals. The investigation is a due diligence exercise in the strict sense: the work of finding out, done before any decision commits money.
The triggers that make a BIA stale
Keeping the analysis accurate is driven by organisational change rather than the calendar. It should be revisited after a merger or acquisition, when new critical systems are deployed, after significant change to a process or supply chain, and following a real disruption. Many organisations also review theirs at least annually.
This matters because a stale analysis does not fail loudly. An organisation that completed its analysis before migrating to the cloud has different dependencies, different recovery options, possibly different critical functions. It still believes it knows its recovery priorities, and nothing in its documentation says otherwise.
How a business impact analysis identifies critical business functions
The first step builds a complete inventory of business functions and determines which are critical. A critical business function is one whose disruption would cause significant financial loss, legal liability, regulatory non-compliance or reputational damage. The load-bearing word is significant: every disruption causes some inconvenience, and the analysis is looking for the functions whose loss would threaten the organisation’s ability to operate.
The criteria that decide criticality
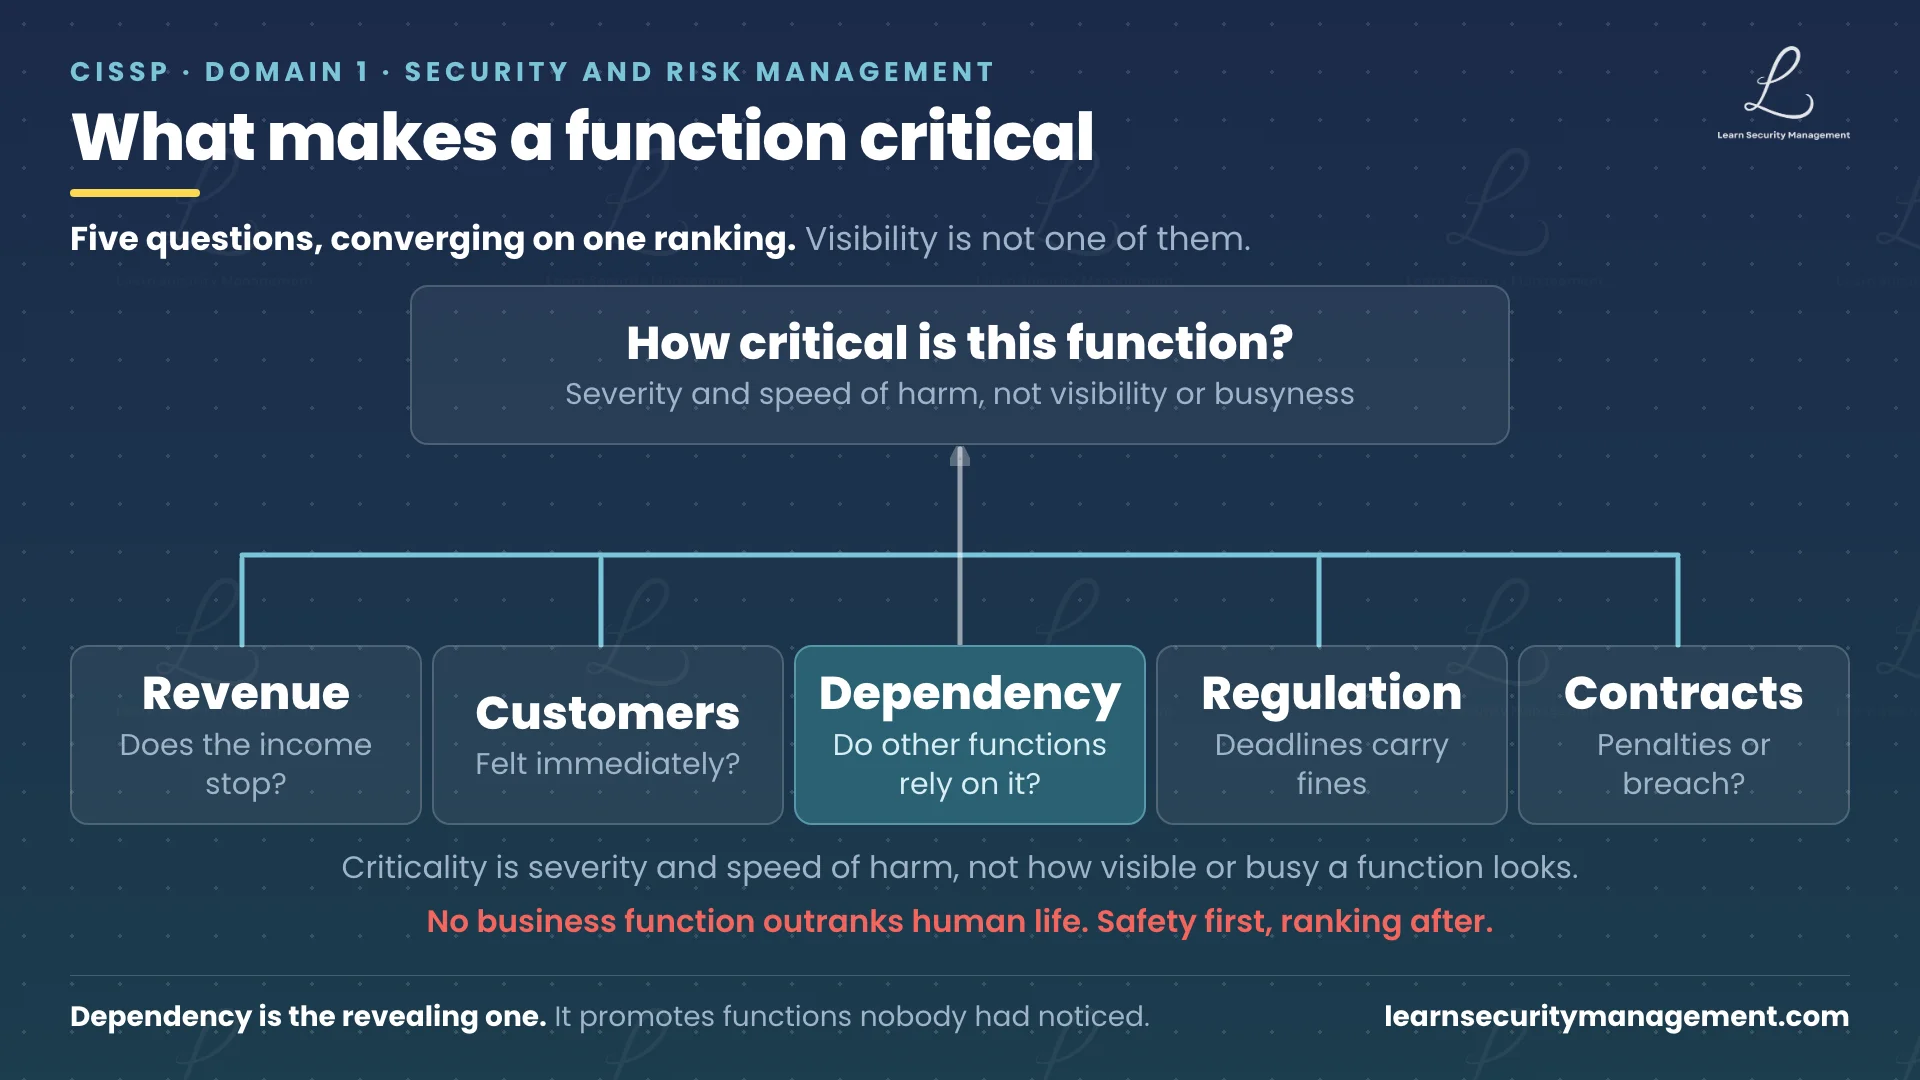
Five questions do most of the work. Does the function directly generate revenue? Would customers feel the disruption immediately? Does it carry a regulatory deadline that triggers a fine regardless of cause? Do other critical functions depend on it? Would a disruption breach a contract?
Dependency is the most revealing of the five, because a function feeding three other processes is more critical than its own description suggests. Criticality is also not the same as visibility: a shipping-label system sounds routine and may be the bottleneck that stops a warehouse, while an executive dashboard feels important and the organisation may survive without it for days.
Life safety overrides every other criterion
Any function affecting human life or physical safety is the highest priority, ahead of revenue, data and any financial consideration. Where a scenario sets safety against cost, safety is expected to win, and answer options that trade it away tend to be distractors however well justified commercially.
How BIA data is gathered: interviews, questionnaires and records
With the critical functions identified, the team collects detail about each one, and each method surfaces a different class of fact.
| BIA data gathering method | What it is best at | What it misses |
|---|---|---|
| Structured interview with a business unit leader | Depth, follow-up questions, and situational detail that formal documentation never captured | Slow, and only as good as the interviewer’s questions |
| Standardised questionnaire | Consistent, comparable data across many departments at once | No follow-up, so an unexpected dependency goes unrecorded |
| Cross-functional workshop | Untangling dependencies that cross departments, because everyone is in the room together | Group dynamics can let a dominant voice set the ranking |
| Financial and operational records | Hard numbers: revenue, transaction volumes, penalty clauses, service level commitments | Says nothing about how the work is actually done |
Interviews are the most valuable of the four, because follow-up questions expose operational reality: asking what would break first, and what the team would do in the first hour, surfaces dependencies no process document records. The practical constraint is where the analysis most often degrades. Data gathering is the slowest phase, because it competes for the time of the busiest people, and without management sponsorship the team accepts rushed answers that quietly undermine everything built on top of them.
Quantitative vs qualitative impact analysis
Measuring impact has two dimensions, and a thorough analysis needs both. The quantitative side is defensible in a budget conversation; the qualitative side captures harm that never appears on an invoice, which in a public outage is frequently the larger half.
| Quantitative impact analysis | Qualitative impact analysis | |
|---|---|---|
| What it measures | Consequence expressed in money | Consequence that resists a figure |
| Typical categories | Lost revenue, increased operating costs, contractual penalties, regulatory fines | Reputational damage, loss of competitive advantage, employee morale and retention, legal exposure |
| Where the evidence comes from | Finance records, transaction volumes, service level agreements, penalty clauses | Interviews with business unit leaders, customer and market judgement, legal and compliance input |
| Its weakness | Understates harm that never appears on an invoice | Hard to defend in a budget conversation without the quantitative side beside it |
Increased operating costs are the category most often forgotten: overtime, emergency vendors, temporary facilities and expedited shipping accumulate quickly, and are incurred whether or not the revenue was recovered. On the qualitative side, reputational damage tends to be the most lasting, because customers who leave during a visible outage frequently do not come back.
How impact grows over time
The analysis measures impact at several outage durations rather than once, because the damage at one hour and at three days are not the same kind of thing. For a mid-size retailer losing order fulfilment, one hour is a small backlog absorbed within normal operations; four hours means cancelled orders and lost revenue approaching £200,000; twenty-four hours breaches shipping guarantees and triggers contractual penalties; and by seventy-two hours retail partners are sourcing elsewhere and the reputational damage may take months to repair.
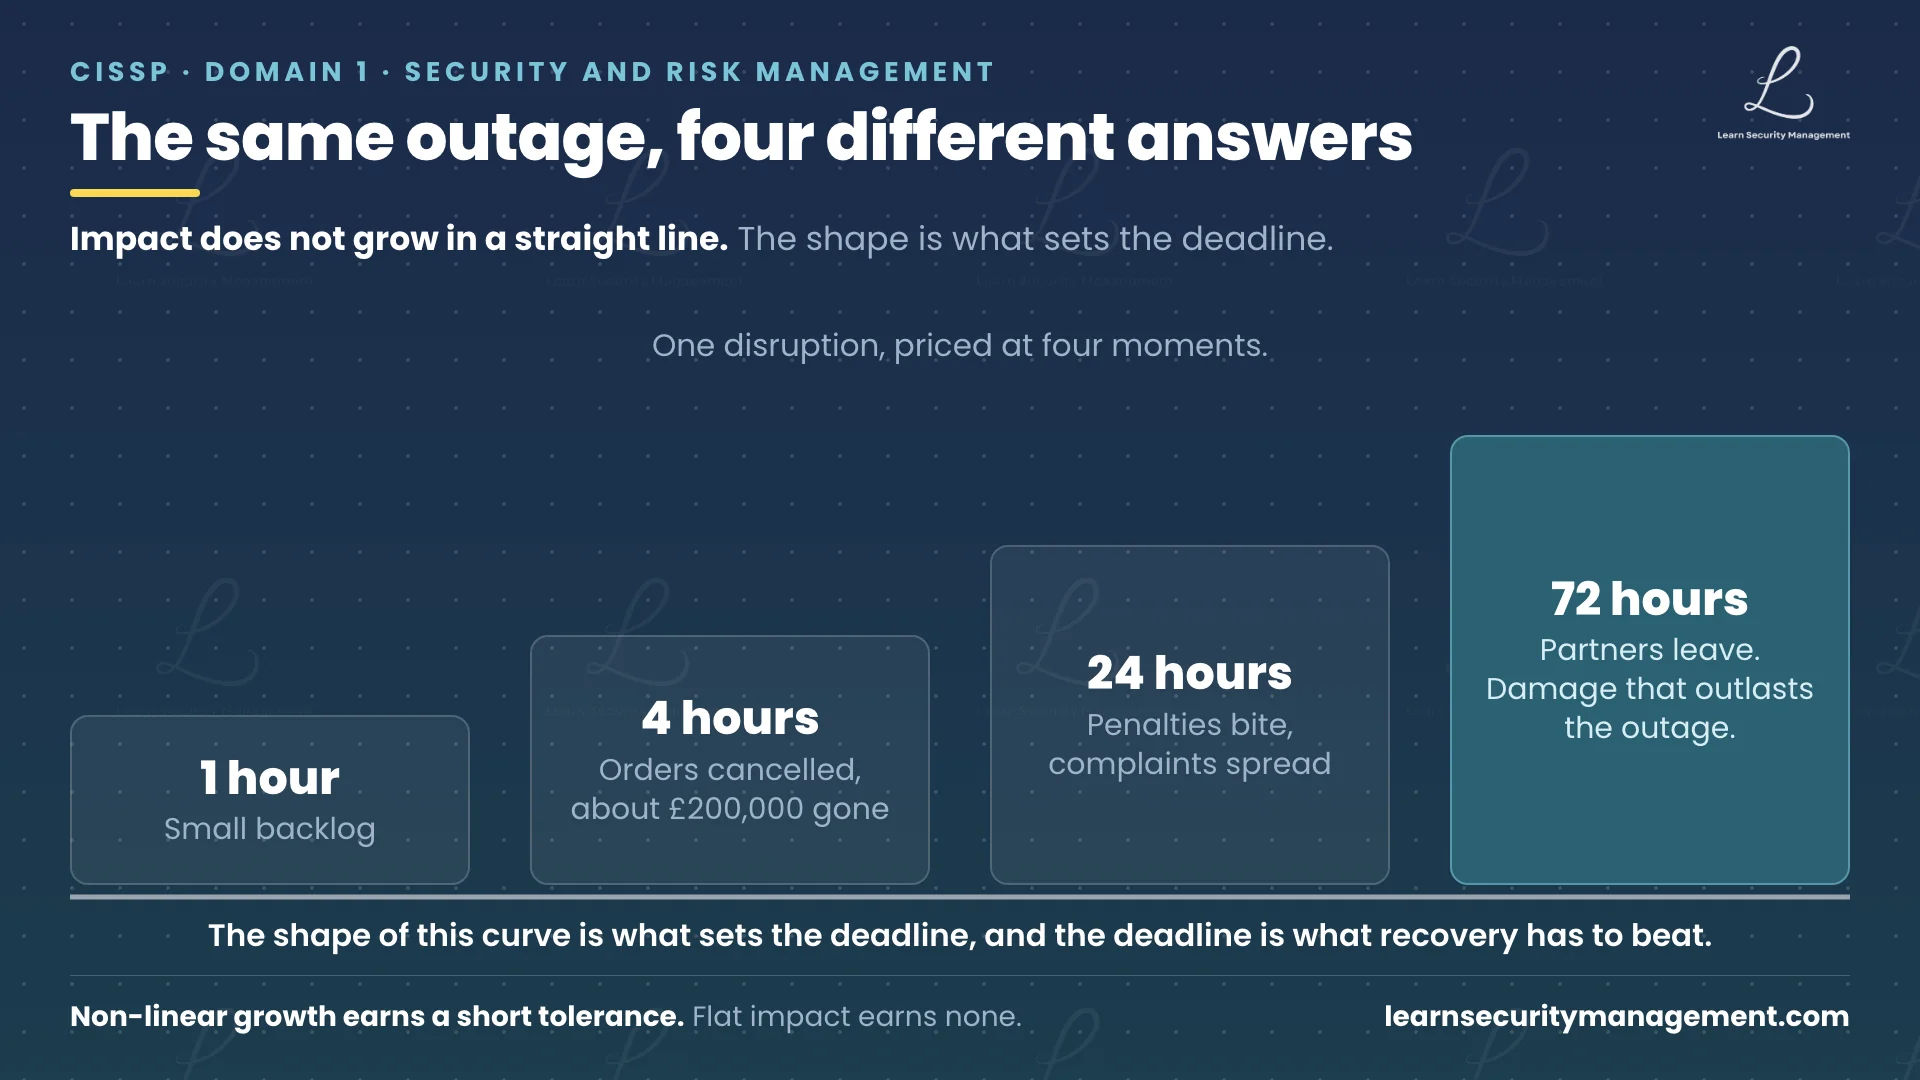
The shape of that curve is the finding, not the individual numbers. Impact grows faster than time passes, and somewhere on the curve is a point past which the organisation does not fully recover. Non-linear growth is what earns a function a high criticality ranking and a short tolerable downtime, and a function whose impact stays flat for days earns neither however visible it is.
Dependency mapping and single points of failure
Dependency maps record how business functions, technology systems, personnel, suppliers and facilities interconnect. They are among the most valuable things the analysis produces, for a slightly counterintuitive reason: they routinely find risks that the criticality ranking, done properly, would still have missed.
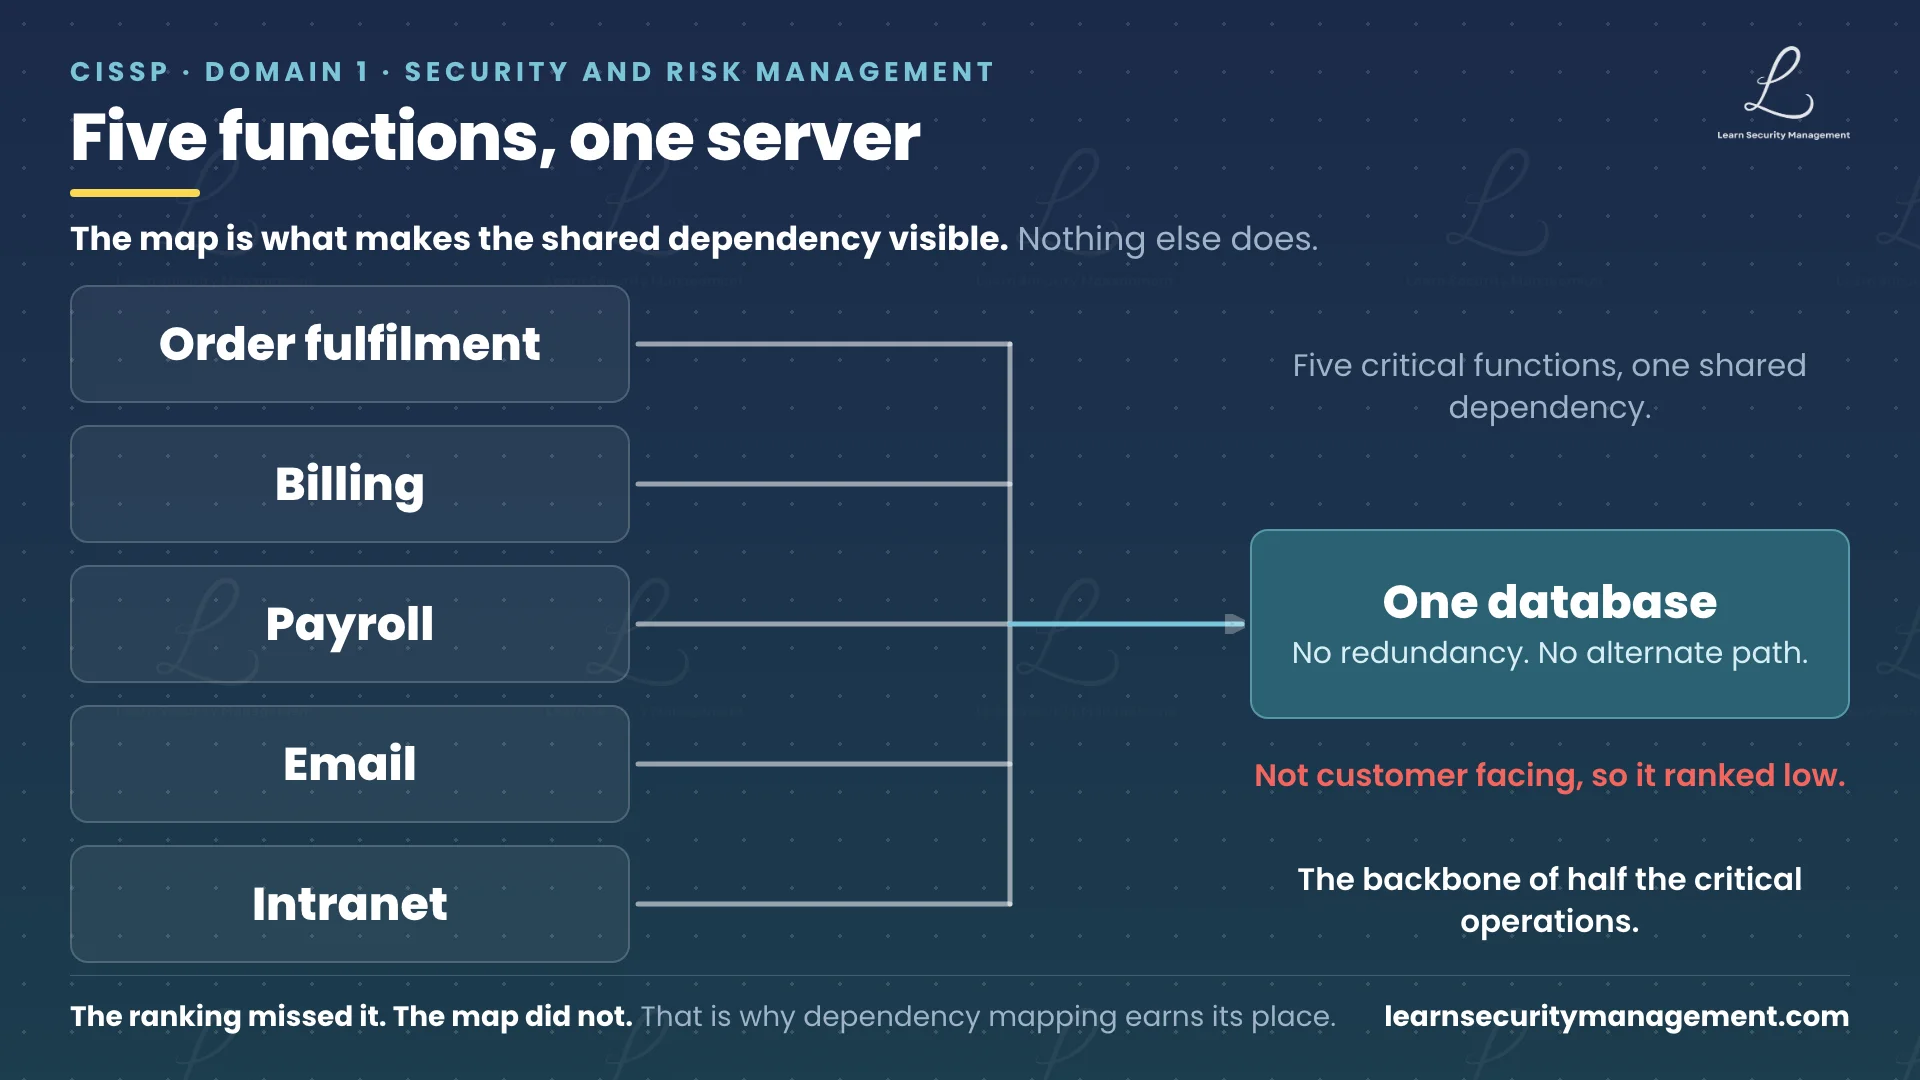
The canonical example is a single database server with no redundancy that five business functions all depend on. Assessed on its own it is not customer-facing, generates no revenue directly and carries no regulatory deadline, so it ranks low. Assessed through the dependency map it is the backbone of half the critical operations, and its loss takes down five functions at once.
Suppliers produce the same pattern, which is why supply chain risk management belongs inside the analysis rather than beside it, and so do people: a function depending on one individual’s undocumented knowledge has a single point of failure no infrastructure diagram shows. Mapping is also what keeps recovery sequencing honest, since restoring a function without its data feeds or suppliers produces something technically available that cannot actually operate.
What a business impact analysis produces
The analysis hands six things to the recovery strategy phase, and together they form a specification the strategy has to satisfy.
- Criticality rankings that sort functions into a tiered recovery schedule, deciding who gets resources first.
- Recovery targets for each function: the maximum tolerable downtime that bounds everything, the recovery time objective for restoring the function, and the recovery point objective fixing how much data loss is acceptable. Those metrics, and how they sit together on one outage timeline, are worked through in the recovery metrics guide.
- Impact assessments at several outage durations, which justify the spending when senior management asks why a capability is worth its cost.
- Dependency maps across systems, data, suppliers, facilities and people.
- Resource requirements: the minimum people, technology, facilities and supplies to run each function during recovery, not normal capacity.
- Gap identification, contrasting the capability the analysis requires against what exists today. A function with a two hour tolerance and a twenty-four hour backup strategy has a gap that becomes an action item.
Every one of those is consumed by the next phase, and a mismatch between what the analysis found and what the recovery strategy delivers is among the most common continuity failures there is.
Where a business impact analysis goes wrong
- A recovery strategy that cannot meet the tolerance. An eight hour maximum tolerable downtime against a cold site that takes days to activate fails the constraint however cheap it is. The tolerance comes first and the strategy fits it, never the reverse; the site options are compared in the disaster recovery sites guide.
- IT setting the metrics alone. Criticality and tolerable downtime are business judgements, and when IT decides them unilaterally the numbers reflect technical convenience rather than business need.
- Confusing the analysis with a risk assessment. Mixing consequence with likelihood produces a document that does neither job well.
- Setting a recovery target longer than the tolerance. This guarantees the organisation breaches its own limit, and usually means the target was set from what is currently achievable rather than what is required.
- Ignoring dependencies. Restoring a function without what it depends on leaves it unable to operate.
Conclusion
A business impact analysis is the evidence that turns recovery spending from a guess into a decision. Without it an organisation buys protection blind, about as likely to over-protect something trivial as to leave something vital exposed. With it, every subsequent choice, the site, the failover, the backup frequency, the order of restoration, has a number behind it that came from the business rather than from the budget.
The ownership point is worth carrying furthest. The analysis is a business activity that senior management sponsors and process owners feed. IT maps dependencies and later builds the capability, but it does not define what counts as critical. Insisting that recovery strategies be measured against the analysis rather than against what is affordable this year is the discipline the whole exercise exists to make possible.
If you want to test that under exam conditions, the LSM CISSP practice tests are built around exactly these scenarios: telling an impact analysis from a risk assessment, reading an impact curve into a tolerable downtime, and spotting a recovery strategy that cannot meet the numbers the analysis produced, with full explanations for every answer.
Quick reference for the CISSP exam
The five steps in order
Identify critical business functions, gather data from the people who own them, analyse impact quantitatively and qualitatively across time horizons, determine recovery priorities and targets, then document and obtain senior management approval. The analysis precedes recovery strategy selection, always.
BIA against risk assessment
The analysis measures consequence and timing and is threat agnostic. The risk assessment measures likelihood and is threat specific. Probability is the risk assessment’s job; tolerable downtime is the analysis’s job. Both feed the same decision from different directions.
The six outputs
Criticality rankings, recovery targets, impact assessments across durations, dependency maps, minimum resource requirements, and gap identification. All six are inputs to recovery strategy development.
Ownership
Senior management sponsors and approves. Business process owners supply the impact data that sets criticality and tolerable downtime. IT maps dependencies and implements. An option that has IT setting the tolerances alone is one to treat with suspicion.
Spotting the topic in a scenario
Consequence over time, criticality ranking, or the question of how long a function can be unavailable point at the impact analysis. Likelihood, threats and vulnerabilities point at the risk assessment. A shared system that nobody ranked highly and that several functions turn out to need points at dependency mapping. Safety set against cost resolves in favour of safety.